 Section
Navigation
Section
Navigation
3. eBusiness Prospects3.1 B2C: North America
3.2 B2C: South America
3.3 B2C: Europe
3.4 B2C: Middle East & Africa
3.5 B2C: Asia
3.6 B2B
3.7 m-Commerce
3.8 Modeling Trends
3.9 USA forecasts
3.10 China forecasts
3.11 EEC forecasts
3.12 India forecasts
3.13 Japan forecasts
3.14 UK forecasts
3.15 Russia forecasts
3.16 Brazil forecasts
3.17 World forecasts
 Sources
 3.16
Brazil: Economic Models
3.16
Brazil: Economic Models
Brazil is the largest country in Latin America, by population and land area. The country received Portuguese colonizers in the sixteenth century, African slaves to work the plantations in the seventeenth and eighteenth centuries, and some 5 mn Europeans between 1875 and 1960. 81% live in urban areas, notably near the coast and in the south-central part of the country.
The country was claimed by Pedro Álvares Cabral under the sponsorship of the Portuguese fleet in 1500, and then divided among various noblemen through the Hereditary Captaincies system. For three hundred years Brazil remained a colony of Portugal, but declared its independence in 1822, becoming first a constitutional monarchy, and then, by a military coup in 1899, a republic. The army played an important role in the dictatorships of 1930-1934 and of 1937-1945, and in the period of military rule of 1964-1985. Rule became gradually more liberal, exiled politicians being allowed to stand for state and federal offices, and Brazil completed its transition to a popularly elected government in 1989, when Fernando Collor de Mello won 53% of the vote. A major corruption scandal led to his impeachment in 1992, and Vice President Itamar Franco governed for the remainder of Collor's term. {1-7}
All presidents since have been elected democratically and served out their term. Fernando Henrique Cardoso took office in 1995, and pursued a program of ambitious economic reform. He was re-elected in 1998 for a second 4-year term. Luiz Inacio Lula da Silva, elected president in 2002, and again in 2006, pursued moderate socialist policies aimed at fighting widespread poverty. He was succeeded by Dilma Vana Rousseff, also supported by trades unions, who prioritized growth with equity policies to eradicate poverty and fiscal austerity. Human rights, gender equality, social inclusion and government transparency were also among her aims. {1-7}
Economy
The economy is the postwar period is commonly divided into these phases:
1945-62:
strong import substitution, especially of consumer goods: GDP grew at 7% (more in
industry, growth 9%, than agriculture, 4.5%).
1962-67: stagnation: GDP growth
fell to 4%: military coup then aimed to make Brazil a capitalist economy and military
power.
1968 -73: rapid industrial expansion and modernization: GDP grew at 11%,
led by industry (which averaged 13%).
1974 -81: import substitution of basic goods
and growth in manufactured exports: GDP growth was 6.9% but debt increased to US$54
bn in 1980.
1981-93: Stagnation and inflation: GDP growth was 2.9% and inflation
rose to 5000% in 1993.
1994-present: liberalization and reduction of investment
controls.
The Plano Real, instituted in 1994, pegged the currency (real) to the dollar and brought inflation under control. Government deficits remained in the 6-7% range throughout the 1990s, however, and the real was overvalued, hurting exports. As a spillover from the Asia crisis, capital that had flooded into the country under liberalization measures took flight, investment falling from US$31.2 bn to US$4.9 bn between 1996 and 1998. The result was a deep recession. GDP growth in Latin America as a whole was 5.3% in 1997, but fell 2.3% in 1998 and then to 0.3% in 1999. Over US$10 bn in rescue loans were provided by multilateral banks, but raised external debt. In 1999 Brazil owed $244 bn or 46% of GDP to foreign creditors. {8} The currency had been set to a crawling peg, which allowed the currency to depreciate at a controlled rate against the dollar, and in early January 1998 the IMF provided a $41.5 bn loan to help Brazil defend its currency when it decided to improve its export position by devaluing its currency by 8%. The move panicked investors, however, and the real had depreciated 66% against the US dollar by the month's end.
The depreciation made payment of Brazil's debt more difficult, but did allow its trading position to improve. GDP growth increased from 0.8% in 1999 to 4.3% in 2000, {8} but worries over Argentina and the leftist credentials of the presidential candidate triggered a confidence crisis. Luis Inácio Lula da Silva won the election, proved not so radical after all, and the economy began to grow more rapidly: 5.7% in 2004, 3.2% in 2005, 4.0% in 2006, 6.1% in 2007 and 5.1% in 2008. The global slowdown struck Brazil in 2009, but GDP growth recovered a year later to reach 7.5% in 2010. {7-8} Efforts to curb rising inflation, and the deteriorating international economic situation, slowed growth to 2.7% in 2011, and 1.5% in 2012, but Brazil overtook the UK as the world's seventh largest economy by GDP in 2011..
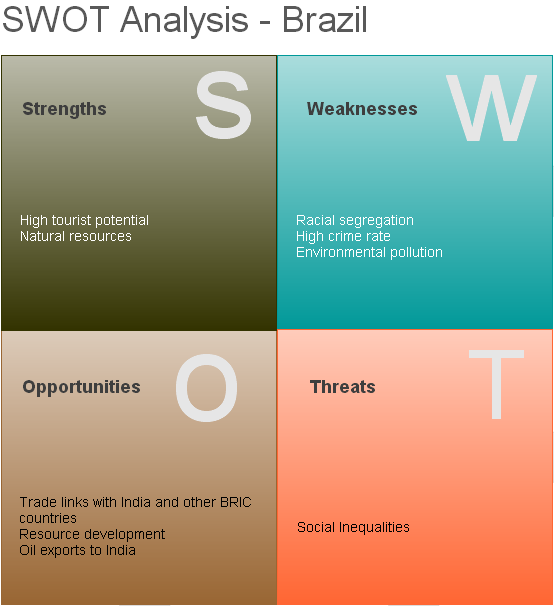
SWOT Analysis
Strengths {9}
High tourist potential
Natural resources
Weaknesses
Racial
segregation
High crime rate
Environmental pollution
Opportunities
Trade
links with India and other BRIC countries
Resource development
Oil exports
to India
Threats
Social Inequalities
Opportunity: Resource Development
Brazil is already a large iron-ore producer, and has transformed itself into an agricultural powerhouse, one to vie with the temperate-climate food exporters of north America and the European Union. {10} The country is attractive to offshoring, having a good telecommunications infrastructure, a strong market for IT vendors, and relatively low costs, reported the McKinsey Global Institute, adding that poor English-language skills and a lack of international experience are still weaknesses. {11} The Santos Basin has the potential to make Brazil at least a medium-sized net oil-exporting country. {10}
In 2005, after five decades of industrialization, the country was annually producing 2.4 mn motor vehicles, 33 mn tons of steel, 34.4 mn tons of cement, 5.9 mn television sets, 23.3 mn cellular phones, and 4.8 mn refrigerators. Paved roads increased from 36,000 km in 1960 to 190,000 km in 2006. Brazil had 90,700 megawatts of installed electric power capacity in 2004, and over 60 % of its exports consisted of industrial products. It is the world's largest producer of sugar and concentrated orange juice, and the world's largest exporter of soy, cattle meat, and tobacco. These achievements transformed Brazil into an advanced industrial society, though wealth is very unevenly distributed. {12}.
Model: Import Substitution
 Over
much of the 1945-93 period, Brazil's economic model has been import substitution,
i.e. to move away from simply supplying raw materials and encourage local industries
to manufacture what was being imported. {14-15} The model is a common one in the developing
world, and Brazil used foreign exchange controls to protect selected segments of domestic
industry and facilitate import of the necessary fuel and machinery. Special attention
was given to the automotive, cement, steel, aluminum, cellulose, heavy machinery,
and chemical industries. The result was growth in durable good manufactures, a large
foreign debt and decline in the contribution of non-durable goods to the economy.
Textiles, for example, the dominant industry before the war, experienced a decline
in the value added by industry from 20.1% to 11.6% over the 1949-60 period. {7}
Over
much of the 1945-93 period, Brazil's economic model has been import substitution,
i.e. to move away from simply supplying raw materials and encourage local industries
to manufacture what was being imported. {14-15} The model is a common one in the developing
world, and Brazil used foreign exchange controls to protect selected segments of domestic
industry and facilitate import of the necessary fuel and machinery. Special attention
was given to the automotive, cement, steel, aluminum, cellulose, heavy machinery,
and chemical industries. The result was growth in durable good manufactures, a large
foreign debt and decline in the contribution of non-durable goods to the economy.
Textiles, for example, the dominant industry before the war, experienced a decline
in the value added by industry from 20.1% to 11.6% over the 1949-60 period. {7}
So would run a balanced account of Brazil's economic fortunes compiled from mainstream sources. To native Brazilians, matters look very different, and Chossudovsky {16} documents the painful 1990-4 transition to open markets. Under Wall Street pressure, the IMF required that loan repayment be stepped up, state assets privatised to pay foreign debt, the public sector workforce be slimmed down and wages slashed to give the country a cheap labour export economy. The 300 leading Brazilian families, well capitalized and linked to overseas businesses and institutions, were able to profit from the new opportunities and prospered, but not the vast majority. Welfare programs were needed to provide food and accommodation to a new class of poor, both civil servants laid off and small businesses made bankrupt by overseas competition. Reforms were hard fought through the legislature, and, even when successful, governments found themselves tied to the IMF and international concerns in ways they had little control over. {20} The immediately following years of rapid investment and capital flight, more IMF intervention and more austerity, led to the familiar pattern of impoverishment of all sectors save the very rich. Globalization can come at a cost not borne equally by countries or business sectors. {19}
Outlook
The global turndown continues to affect Brazil, and predicted growth in 2012 is put at 2%. To move to a more sustainable economy from the two years preceding, where growth was fueled by consumer spending and expansion of credit facilities, the government in August 2012 announced a US$60 bn stimulus package to improve infrastructure, i.e. to an internal investment model. Plans include 8,000 km of new roads, 8,000 km of railways and subsequent investment in ports and airports. Whether this is sufficient to restore the economy in the long term is much debated. {10-11} Results to date have been modest. {17} Neoliberals argue for less state control, tax reductions on business and a more independent judiciary. {18}
eBusiness Implications
Brazil has important reserves of iron ore, bauxite, tin, coal and copper, and is the world's largest producer of niobium (94.3%) and the second largest of iron ore (20%). Though concentrated in the traditional mining state of Minas Gerais, mineral exploration extends across the country, even in the Amazon basin where large areas await detailed prospection. {13} The Internet is important throughout.
Mining
companies are heavily dependent on information, and, well before establishing an office
in a new country, will have conducted extensive literature studies to assess such
matters as:
1. Mining legislation: is it fair and sustainable? What are the tax
regimes? Can profits be repatriated? What governments incentives exist?
2. Political
stability: does the government enjoy general support, and is it one the company would
wish to associate with? What changes are likely, and how would these affect investment?
3. Mining history: what has been produced where, and at what cost? Who is currently
exploring: where and what for: budgets and success stories?
4. Geological indications:
what mineral zones can be recognized, and what would be the exploration costs to find
what targets?
5. What data are available: geological maps, airborne and remote
sensing surveys? Is information in the public domain or locked away in competitor
files?
5. Joint-venture or go it alone? Which companies have the best prospects
and might welcome the expertise and access to development funding?
Mining majors have departments devoted to such issues, but all companies use the Internet for information, often subscribing to commercial databases. Transportation costs will be high in the Amazon basin, for example, and reverse feasibility studies would be undertaken to establish minimum targets, obviously either large enough to be worth building roads and railways (ore ore) or high-value deposits where transportation costs are less important (diamonds or rare earths).
Once exploration areas have been chosen and base camps set up, much of the data collation will be done in the main cities or even abroad, but the results will be relayed to the base camps by Internet, either a company intranet or by cloud computing. Smaller mining companies funded by share issues will report those results to the public via websites, particularly in the later stages of drilling targets and proving up reserves. Potential investors will expect to be able to check exploration and mining permits, areas explored, the results of geological and geophysical work, drilling results and assays, relevant cross sections and expenditures: to date and prospective. Exploration work is hard, uncomfortable and sometimes dangerous. Companies keep their staff in touch with home and each other, sharing results to foster a sense of common purpose. Again the Internet plays a key role, often now through mobile phones or tablet computers.
 Points
to Note
Points
to Note
1. Successes and shortcomings of the import substitution model.
2. Inward investment and resource development.
3. Increasing importance of information,
often Internet-based.
 Sources
and Further Reading
Sources
and Further Reading
1. A Concise History of Brazil by
Boris Fausto. Trans. by Arthur Brakel. C.U.P. 1999.
2. The New Brazil by
Riordan Roett. Brookings Institution Press. 2011.
3. Brazil: History. Geographia.
2006.
4. The Economic History of Brazil (Brasil) by Thayer Watkins. San
José State University.
5. Background Note: Brazil. Bureau
of Western Hemisphere Affairs. US State Dept. November 2011.
6. A Brief
History of Brazil's Growth by Eliana Cardoso and Vladimir Teles. OECD.
September 2009.
7. Economic history of Brazil. Wikipedia.
June 2012.
8. Brazil's 1998-199 Currency Crisis by Mike Evangelist and
Valerie Sathe. Univ.
of Michigan. November 2006.
9. Brazil Presentation : 3. SWOT Analysis
by Hyeong Keun Kim.
Korea Science Academy of KAIST. 2011.
10. Four reasons to believe in Brazil.
The
Economist. July 2010.
11. Assessing Brazil's offshoring prospects
by Diana Farrell, Martha Laboissière, and Bruno Pietracci. McKinsey.
March 2007.
12. The Brazilian Economy: Growth and Development by Werner
Baer. Excerpt from 6th Edition. Rienner.
2008.
13. Brazil Mining Report. Gov.
of Ontario. September 2011.
14. Import substitution as economic development
by Avik Basu. Univ.
of Michigan. April 2005.
15. Import substitution industrialization.
Wikipedia.
June 2012.
16. The Globalization of Poverty and the New World Order, Second
Edition by Michael Chossudovsky. Global Research, 2003. Chapter 13.
17. Brazil
Economy 2013. Theodora.
February 2013.
18. Brazil. 2013 Index of Economic Freedom.
Heritage.org.
Accessed May 2013.
19. Historical Roots of the Social Crisis
in Brazil. The Role of the IMF by Michel Chossudovsky. Global
Research. June, 2013.
20. India's rupee hits another record low against
US dollar by Heather Stewart. Guardian.
August 2013.