 Section
Navigation
Section
Navigation
7. Technical Aspects
:Fundamental
7.1 Anatomy of Internet
7.2
Telecommunications
7.3 Wireless systems
7.4 Client Computers
7.5
Mobile Devices
7.6 Operating Systems
7.7 Computer Programs
7.8
Security: Applications
7.9 Browsers
7.10 Business Intelligence Systems
7.11 Cloud Computing
7.12
Databases
7.13 DTP Programs
7.14
eBook Readers
7.15 eMail Services
7.16 Expert Systems
7.17
Graphics Programs
7.18 Internet TV
7.19 Music & Video
7.20
Really Simple Syndication
7.21 Rich Media
7.22 Search Engines
7.23
Spreadsheets
7.24 Video Conferencing
7.25 Word Processing
:Corporate
Matters
7.26 Cluster Analysis
7.27 Neural Networks
7.28
Pricing Models
7.29 Realtime Systems
7.30 Regression Analysis
 7.30.
Regression Data Analysis
7.30.
Regression Data Analysis
In this fictitious example, you sell top-of-the-range
beauty products through a complex network of reps throughout the USA. Leads for
new territories are generated on your website, and the more promising candidates
are trained to sell in their area. Remuneration is by commission only, and most
of the sales force are women who work part-time. Each salesperson has to place
a minimum order for your products (at discounted prices) and is encouraged to
recruit other reps, who also work on a commission basis, paying 3% of their commission
to their recruiter. A sliding scale of commissions is paid through the chain of
recruitments generated in this way, and the policy has proved very effective.
When a sales territory achieves a sufficient sales figure, you organize a special
promotion, hiring a small conference center, flying in executives and top salespeople,
and distributing samples. These promotions are your key selling strategy, greatly boosting recruitments and sales, but they are also expensive. In the economic downturn you've found that several have not left you much in profit. How can you tell when promotions are worth undertaking? More exactly, how — based on your past sales records — can you estimate their effectiveness so that promotions don't overspend?
Theory
What you need is an algorithm like:
Increased Sales resulting from Special Promotion = $A + ($B x Factor B) + ($C x Factor C) + ($D x Factor D) + . . . ($X x Factor X)
where Factors A, B, C, D, etc. relate to measures you have data
on (e.g. number of reps in area, average number of monthly products sold by reps,
number attending promotion . . .) and the $A, $B, $C, $D etc. are coefficients
(i.e. weightings). You derive values for these coefficients by solving the equation.
For how you solve the equation (there are several ways) you'll have to refer to textbooks, and there you'll also find measures for goodness of fit (R-squared, analyses of the pattern of residuals and hypothesis testing). Statistical significance can be checked by an F-test of the overall fit, followed by t-tests of individual parameters. Yes, it's complicated, and even the articles referenced below only scratch the surface. But the theory is for statisticians: all you need to know is how to run one of the many regression programs on the market. Assemble the data, key it into the data interface, and the programs will estimate not only all the unknowns, but how significant these unknowns are. Having derived the algorithm from past sales data, you can use it to estimate future sales.
But what sort of factors would be relevant in this case? Initially you don't know, and indeed don't have to. The beauty of regression analysis is that the program will automatically sort through the factors, attaching a relevance to them. Most can probably be dispensed with in a simple and robust algorithm, but you won't know before running the regression program. In this case you might start by assembling data as follows. For each special promotion you assemble figures for:
FACTOR |
ABBREVIATION | UNITS |
Increased annual salesin territory resultingfrom promotion | SALES |
US$ '000 |
Average USA businessconfidence over yearfollowing promotion |
CONFID | -2 to +2 |
Number of sales repsin territory beforepromotion | NOREPS | number |
Average monthlysales of reps beforepromotion |
AVSALE | US$'000 |
Affluence of salesterritory (estimated) | TETAFF |
1 to 5 |
Total numberattending promotion(excluding staff) |
ATTEND | number |
You consult your records and key the figures into the regression program:
SALES | CONFID | NOREPS |
AVSALE | TETAFF | ATTEND |
11.5 | 0 |
4 | 0.94 |
3 | 82 |
34.5 | 2 |
9 | 1.24 |
4 | 105 |
7.6 | -1 |
5 | 0.65 |
2 | 74 |
18.7 | 1 |
5 | 1.01 |
1 | 59 |
31.7 | -1 |
12 | 0.79 |
5 | 89 |
6.3 | 2 |
16 | 0.44 |
1 | 208 |
22.6 | 1 |
2 | 1.60 |
5 | 92 |
5.4 | -1 |
2 | 0.65 |
1 | 84 |
12.7 | -2 |
3 | 1.46 |
3 | 158 |
13.6 | 0 |
6 | 0.75 |
2 | 73 |
45.1 | 2 |
7 | 1.50 |
5 | 45 |
11.8 | 1 |
3 | 0.95 |
3 | 83 |
13.4 | -1 |
8 | 0.42 |
5 | 64 |
8.9 | 11 |
5 | 0.64 |
3 | 82 |
26.8 | 1 |
8 | 1.39 |
5 | 73 |
19.5 | 2 |
3 | 0.57 |
1 | 24 |
17.4 | 1 |
4 | 0.87 |
3 | 64 |
You then run the regression analysis, and examine the various measures the program provides for each suggested algorithm generated. Among these are:
Term | Coefficient |
t statistic | | Sourceof Variation | Sumof Squares |
F statistic |
Intercept | -1.507 | -0.39 |
| Model |
1731.5 | 19.02 |
CONFID | 1.213 |
0.82 | |
Residual | 200.3 | |
NOREPS |
2.056 | 4.54 |
| Total |
1931.8 | |
AVSALE | 19.83 |
3.59 | |
| | |
TETAFF |
0.3773 | 0.35 |
| | |
|
ATTEND | -0.1476 | -2.74 |
| | |
|
For the algorithm:
Sales = -1.507 + 1.213 x CONFID + 2.056 x NOREPS + 19.83 x AVSALE + 0.3773 x TETAFF -0.1476 x ATTEND
It's not a bad match, but you'll notice that the weighting for those attending the promotion is negative, i.e. the sales decrease with the number of people attending the promotion. That's hardly what you want, and what does it mean? Perhaps the promotion recruits too many reps lacking the experience and energy to work the territory properly, only spoiling opportunities for others. You might want to cut down on numbers attending by screening out the unsuitable candidates.
Or it might mean that distressed times bring in too many hopefuls looking for supplementary income, i.e. NOREPS is not independent of CONFID. In fact you'd probably do better to rerun the regression package excluding NOREPS data, when this new and more robust algorithm is generated:
Term | Coefficient |
t statistic | |
Source of Variation | Sum of Squares |
F statistic |
Intercept | -4.208 | -0.89 |
| Model |
1594.4 | 14.17 |
CONFID | 4.432 |
3.99 | |
Residual | 337.5 | |
NOREPS |
1.167 | 2.96 |
| Total |
1931.8 | |
AVSALE | 8.739 |
1.87 | |
| | |
TETAFF |
2.145 | 2.02 |
| | |
|
Sales = -4.208 + 4.432 x CONFID + 1.167 x NOREPS + 8.739 x AVSALE + 2.145 x TETAFF
The program gives you a plot of
predicted against actual sales figures:
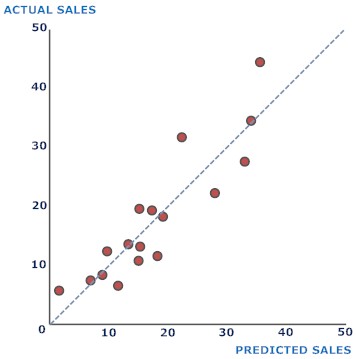
You'd want to refine your methodology for estimating business confidence and affluence in the sales territory, but even as matters stand, regression analysis has:
1. Identified the key factors in your sales promotions.
2. Given
you numerical estimates of their importance.
3. Allowed you to broadly predict
sales, and so avoid promotion overspends.
Resources
1. Statistics on
the Web. Clay Helberg's useful listing of sites.
2. Free
Statistics. Good listing of open source and freeware statistics packages.
3. Wil's
Domain. Straightforward listing of statistics software, both free and commercial.
4. Statistical
Analysis Software Survey. Useful tables if you're familiar with statistics
packages.
5. Numerical Mathematics.
Inexpensive linear regression package.
6. FitAll.
General purpose, nonlinear regression analysis programs.
7. Sagata
Regression. Basic regression packages that work with Excel.
8. StatFi.
Regression package with good list of features.
9. AnalyseIt.
Multifeatured regression package that works with Excel.
 Questions
1. What is regression analysis? Why is it useful?
2. Give a hypothetical
example of its use.
3. In what circumstances could regression analysis be
more useful than cluster analysis or neural networks?
 Sources
and Further Reading
Sources
and Further Reading
1. Regression analysis. Wikibooks.
Extensive sets of articles.
2. Programming Collective Intelligence: Building
Smart Web 2.0 Applications by Toby Segaran. O'Reilly. August 2007. Includes
specimen code in Python.
3. Essentials of Statistics by David Brink.
Bookboon.
2010. Clear and rigorous treatment in 103 pp. free ebook.