 Section
Navigation
Section
Navigation
6. Marketing the Business
:Identifying the
Customer
6.1 Keyword Research
6.2
Market Segment
6.3 Customer Tracking
6.4 Metrics
:Campaigns
6.5
Marketing Campaigns
6.6 Marketing
with Social Media
6.7 Marketing
with Mobile Platforms
6.8 Selling
through Affiliates
6.9 Press Releases
6.10 Copy Writing
6.11
Pay per Click Marketing
6.12 Search
Engine Optimization
6.13 Improving
the Business
 6.3
Customer Tracking
6.3
Customer Tracking
Most hosting companies supply traffic statistics: daily or monthly figures for pages viewed, average time spent on the site, pages entered by or left, sites and search engines generating the visitor traffic. All repay careful scrutiny, but companies generally need more information if they are to read the minds and motivations of their customers, which in turn indicates which pages need to be extended or improved.
The largest companies employ their own proprietary programs, but others use services provide by third parties. A snippet of code is added to all pages in the site, and this code sends the third party server the necessary statistics: page come from, page gone to, and how long the page in question was viewed. The more sophisticated programs aggregate the information in helpful measures (conversion rates, ROI, etc.) and provide sales staff with vital metrics.
Introduction: Test Splitting
Small differences in copy or page layout can make huge differences to sales. Companies generally follow the advertising industry and continually experiment, monitoring the results carefully. Needless to say, the site has to work flawlessly, with all questions and customer options anticipated and funneled towards the checkout page. The shorter the selling route, the better is the conversion rate generally.
Ad copy in generally tested in two places:
1. The search engine ad, the more so as click through-rates here will markedly affect what is paid for each click.
2. The landing page, which directly affects the cost of acquiring a customer.
Different pay-per-click
engines need not interfere with the first option since they can point to different
landing pages. For the second, companies need to split-test. The principle is simple.
A visitor coming to a site is given a cookie, and directed to one of two test pages.
The two pages are similar, but have differences whose effect the company wishes to
measure — different sales copy, prices, or perhaps free gifts. By monitoring
subsequent behavior, marketers can tell which gives the better result.
Won't customers be confused if they come back later and are taken to the other test page? Yes, but they're not. The software allocates each visitor to one of two equal streams, and the cookie ensures that later visitors go back to the same test page as before. The picture might be this:
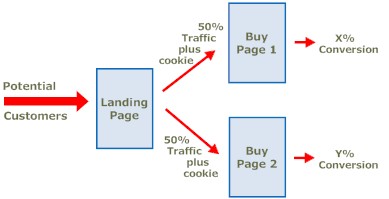
If y% is more than x%, then Buypage2 is the more successful. But how do you create the pages and get them to work?
Various programs are available, but the approaches are much the same. The landing page has some embedded code to give the visitor a cookie, and to send them to testpage1 or testpage2. These and the buypages also have embedded code, which counts the number of times they are visited, and stores this information in a database. Commonly the language used is PHP, which links up neatly with the MySQL databases supplied by Unix-based hosting companies (or possibly ASP and an Access database on a Windows-based server.) Hosting companies will explain what's entailed, and databases are often tossed in for free these days.
Conversion Booster is a split tester for the Windows platform, and Marketing Strategy needs php4 and a MySQL database.
Traffic Analysis
Even the most basic web traffic programs (such as commonly provided by web hosting companies) will provide some data on:
1. Visitors by country.
More detailed analytics will show a breakdown to city, together with the total number
of visits, pages per visit, average time on site, percent new visits, and bounce (only
one page visited) rate.
2. Visitors by language: more detailed programs again
with a breakdown as above.
3. Visitor trends over time: hour, day, week, and month.
4. Visitor loyalty: what percent returned one, two, three days ago, etc. How long
they stayed and on what pages.
5. Visitors' browsers: useful to ensure the site
looks its best.
6. Visitor's equipment: operating system, screen colors, resolution,
flash versions installed, java support: all suggesting sophistication or wealth of
visitors.
7. Visitors' network properties: ISPs they use, which hosts drive the
most traffic, and at what speeds their visitors connect.
8. Visitors' mobile devices:
becoming increasingly essential to know and build alternative sites for.
More Advanced Metrics
Most companies require more data, and use programs that provide click density analysis and task completion rates.
Click Density Analysis
Click density analysis records where on web pages visitors actually clicked. In time a pattern of clicks emerges ('heat map') which identifies points of interest and links etc. that are overlooked or not of interest to visitors.
Task Completion Analysis
Task completion analysis measures the ease or otherwise by which visitors accomplish what they visited a website for, be that simply for information or to make a purchase. Visitor behavior has therefore to be tracked, its purpose identified, and the number of pages viewed and/or time taken to accomplish that purpose measured as site modifications are made. Sites easy to navigate become popular and more successful with sales.
Funnel Analysis
Funnel analysis measures the ease or otherwise with which a visitor step by step accomplishes a desired task on the website. If the four-step path had these conversion rates 100% > Index Page 60% > Product List 18% > Product Pricing 29% >Purchase, the overall site conversion would be 3.1%, with a significant problem identified in the step from the Product List page to Product Pricing page. Website redesign would be indicated, possibly by incorporating prices with the product list.
Advanced Metrics Resources
Currently there are three big vendors: Coremetrics, Omniture, WebTrends, and WebSideStory, and many mid-market vendors such as ClickLab, HitsLink, Index Tools, and Virtual Traffic Master. In 2006 Google released an excellent tracking tool: its free Google Analytics Traffic Moniker.
Interpreting the Figures
Traffic analytics programs generate vast amounts of data, whose value lies only in what they have been set to measure, and how intelligently those measurements are interpreted. Companies are therefore usually advised to continually modify pages and tracking measures so as to:
1. Analyze (ever more closely) the market segment they are selling
into.
2. Construct models of their target customers.
3. Study the website
behavior of those customers with task completion and funnel analysis to identify the
key selling points.
4. Track the metrics of the key selling points as they are
intelligently extended and modified.
Marketing can then get a sensible handle on such questions as:
1. What are the most productive inbound traffic streams,
and which sources are we missing?
2. Have we become better at allowing our customers
to solve their problems via self-help on the website, or is telephone support preferable?
3. Are product white papers impacting on the bottom line?
4. What is the cost
for us to earn each dollar on our website?
5. How does our website affect offline
sales?
These and other answers need to be compared with industry averages, available from Hitwise, American Customer Satisfaction Index and other sources.
 Questions
1. Why is tracking the customer's progress through a website important, and
how is it accomplished?
2. What traffic information is commonly provided by hosting
companies? How can it be useful?
3. Explain test splitting.
4. Name three
advanced metrics, and explain what they do.
5. What sort of questions does marketing
expect these metrics to answer?
 Sources
and Further Reading
Sources
and Further Reading
1. Web Analytics: An Hour a Day
by Avinash Kaushik. Sybex. June 2007.
2. Sams Teach Yourself Google Analytics
in 10 Minutes by: Michael Miller. Sams. June 2010.
3. Click Density Analysis.
RecommendedWebTools.
Explanation, example and recommended services.
4. Web's Key Management Metric:
Task Completion by Gerry McGovern. May 2007. CMSWire.
Brief account.
5. Funnel Analysis for Online business by 'Paul'. April
2010. WebAnalyticsSimplified.
Pictorial explanation.
6. Identifying Conversion Problems from the Product Page
by Pamela Hazelton. Practical
Ecommerce. February 2012.
7. How to Test Multiple Variables on an Ecommerce
Site. Practical
eCommerce. November 2011.
8. 10 Most Important Features of Ecommerce Product
Pages by Pablo Palatnik. Practical
Ecommerce. March 2012.
9. 14 Customer Feedback Tools for Small Business
by Sig Ueland. Practical
Ecommerce. June 2011.
10. Top 10 Converting Websites: The 3 Common Strategies
by Charles Nicholls. Practical
Ecommerce. October 2010.
11. Identifying Conversion Problems from the Product
Page by Pamela Hazelton. Practical
Ecommerce. February 2012.
12. How to Test Multiple Variables on an Ecommerce
Site. Practical
eCommerce. November 2011.
13. 10 Most Important Features of Ecommerce Product
Pages by Pablo Palatnik. Practical
Ecommerce. March 2012.
14. 14 Customer Feedback Tools for Small Business
by Sig Ueland. Practical
Ecommerce. June 2011.
15. August 2010 Survey Results: Conversion Rates
by Kate Monteith. Practical
Ecommerce. September 2010.
16. Conversion: Pros and Cons of Four Checkout
Methods by Pamela Hazelton. Practical
Ecommerce. August 2010.
17. Four Ways to Increase Conversion Rates
by Armando Roggio. Practical
Ecommerce. June 2010.
18. 24 SEO Browser Extensions by Sig Ueland.
Practical
Ecommerce. October 2012. Concluding article of a four-part series.
19. 10
Ecommerce Checkout Strategies by Pamela Hazelton. Practical
Ecommerce. February 2011.
20. 22 Analytics Tools for Online Businesses
by Matt Ferner. Practical
Ecommerce. April 2011.
21. 6 Essential Google Analytics Features for Every
Retailer by Jaime Brugueras. Practical
Ecommerce. October 2012. One of any helpful articles on this site.
22. 32
Google Tools for Ecommerce Businesses by Matt Ferner. Practical
Ecommerce. February 2011.
23. You selling to me? by Ariane Krol and
Jacques Nantel. Le Monde
Diplomatique. July 2013.