 Section
Navigation
Section
Navigation
7. Technical Aspects
:Fundamental
7.1 Anatomy of Internet
7.2 Telecommunications
7.3 Wireless systems
7.4 Client Computers
7.5 Mobile Devices
7.6 Operating Systems
7.7 Computer Programs
7.8 Security: Applications
7.9 Browsers
7.10 Business Intelligence Systems
7.11 Cloud Computing
7.12 Databases
7.13 DTP Programs
7.14 eBook Readers
7.15 eMail Services
7.16 Expert Systems
7.17 Graphics Programs
7.18 Internet TV
7.19 Music & Video
7.20 Really Simple Syndication
7.21 Rich Media
7.22 Search Engines
7.23 Spreadsheets
7.24 Video Conferencing
7.25 Word Processing
:Corporate Matters
7.26 Cluster Analysis
7.27 Neural Networks
7.28 Pricing Models
7.29 Realtime Systems
7.30 Regression Analysis
 7.28
Pricing Models
7.28
Pricing Models
In this fictitious example, you work for a new software house with killer
application now out of beta-testing. What are you going to price it at?
Pricing generally reflects fixed and variable costs.
Fixed costs include:
1. Product development costs: these have to be gradually recouped and
loans repaid.
2. Costs of maintenance, support and further development.
Variable costs include:
1. Office, salaries and website costs:
2. Marketing spend.
A demand curve is a plot of price against quantity sold, and is often found by testing: how many items are sold over comparable periods. The optimal price is that achieving the most profit, where profit = numbers sold x profit on each item sold. In a competitive market, prices tend towards the marginal price, the incremental cost of producing an additional item with fixed costs excluded, i.e. additional variable cost.
Internet Pricing Models
Many companies in the early days of ecommerce priced below the marginal cost, occasionally for next to nothing, so as to:
1. Build market share or dominance.
2. Create a large customer base that could then be targeted with advertising
or premium services.
Such policies are not sustainable for long without understanding financiers or subsidies from other parts of the business, and many Internet companies indeed burned out. Pricing is a difficult but vital matter. There are many models, the more common being:
Free
Google offers free office applications that build market awareness of its other (commercial) services.
Freemium
Basic service is free but extra facilities come at a cost. Many software houses market their programs this way, and online newspapers commonly provide some news free but ask a subscription for access to archives and more detailed articles. Sometimes the free service pays its way by providing valuable marketing information.
Versioning
Here the same product is sold to different market sectors at different prices. The antique trade works this way: a dealer will buy a superb Chippendale at a country sale and mark it up several hundred percent for his Bond Street gallery. Electronics companies produce models with minor variations for sale at very different prices in different countries (often through deals with large national distributors). Car makers produce many models, and prices do not reflect production costs so much as what's seen as sensible in various market sectors.
Bundling
Bundling works on the principle that, while customers may disagree on the value of a single product, their views converge as more products are added to the offer. Microsoft sells Word, Powerpoint, Excel and Access as its Office bundle, customers getting 'cheap' what they may not use. Subscription libraries offer access to tens of thousands of articles knowing that only a few hundred will be read in a year.
Dynamic Pricing
Dynamic pricing entails selling as the market will bear. There are two approaches: auctions and yield management. Prices are set at auction by customers bidding against each other. In yield management, however, companies sell excess capacity (flights, theater seats, hotel rooms) into different market segments, adjusting the price until the excess is taken up. Realtime Internet systems play a large part here, indeed have revolutionized the business.
Managing Channel Conflicts
The perceived value of a product can be damaged when the same product is sold at very different prices through different channels (distributors, shops and/or websites). To avoid this, some companies (car makers) display through the web but sell through dealerships. Others (software houses) display but leave sales to partnerships, particularly where the products are complex, needing training and after-sales support.
Objective Approaches: kNN
Is there a more objective way? Pricing should have been planned in the market research stage, before you got your developers together. But perhaps things have changed in the last few months as other companies unveiled their latest money-spinners. What advantages does your product have over the competition, and how much are those advantages worth?
Perhaps the easiest way of assessing the competition is to find your product's nearest neighbor, what's called k-nearest neighbor (kNN) approach. In a graphical plot of, say, price (x) against one feature (y), a simple program would sort through the Euclidean distances calculated as the square root of (x squared + y squared) to find the minimum value. Then the program would find the shortest distance of price plotted against a second feature, and so on, until it found the shortest distance with all features taken into account. But there would be three problems:
1. Comparing on different features would mean bringing different products
into the comparison,
2. You'd be assuming that all the products you compare yours against
were sensibly priced to begin with (i.e. didn't reflect aberrations
in the vendors' sales policies), and
3. The features would all have an equal importance, which is not likely
to be the case.
The weighted kNN algorithm corrects for these drawbacks by:
1. Taking a reliable number (k) of the Euclidean distances, and
2a. Weighting the more distant neighbors in some way, typically: applying
an inverse function: dividing by the (distance plus some small number
added), or
2b. Applying a subtraction function to counter overweighting of close
neighbors, or
2c. Applying a Gaussian function.
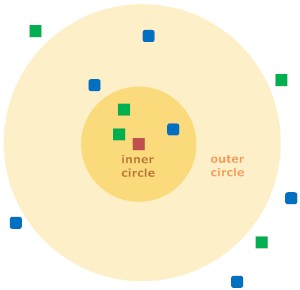
As an illustration, consider the diagram above. The red square can be assigned to either a first class of blue squares or to a second class of green squares. If k (number of close neighbors taken into account) = 3 the square is assigned to the green square class because there are two green squares and only one blue square inside the inner circle. If k = 5 the red square is assigned to the blue square class because the outer and inner circles combined contain three blue squares but only two green squares.
So, to repeat, the weighted kNN gets the sorted distances, and takes the k closest of them. Then it multiplies these distances by the weightings, and calculates a weighted average.
But we still haven't taken account of possible price aberrations, which will have a bearing on the value of k we choose, and the next step is therefore to cross-validate the data.
Cross Validation
First we divide the data into training sets (often 95% of the population) and test sets (5%). The training set is given to the weighted kNN algorithm, which is used to make predictions (say, of the price). The predictions are checked against the test set figures, and an overall score calculated for the algorithm's accuracy. Then the data is divided into new training and test sets, and the accuracy scores again calculated, this being repeated several times. The averaged overall score tells you how good your initial choice of k was, and you can then adjust k and run cross validation again until prediction is acceptable.
Generally you'd run the kNN algorithm in just two dimensions first (e.g. price and feature one) because you'd need to scale (i.e. weight) the importance of second against the first. You could do that manually, but cross validating the data would help show that the scaling was sensible.
Uneven Data
Suppose your competitor's software is not broadly comparable to our yours, but includes other pricing considerations, not strictly based on features. Perhaps your competitors suddenly need a cash flow. Or they're aiming at the corporate sector, adding functionality to an already existing product. These unknown factors can confuse the picture and make your kNN analysis unreliable. Your best course may then be to: graph the distribution of prices, showing the results visually in Excel or a statistical package, and possibly (if matters are still not clear) run a probability package that graphs probability of a certain price range against selected features of choice.
Using Data
If you've only got 30 competing software programs to consider, then your best bet is probably to purchase a cheap statistical package and key in the data. But that becomes less practicable in other market sectors, where you have hundreds of competing items each with dozens of relevant features: To save time and prevent entry errors you'll want programs that automate the process. All the above steps — in a great more detail than given here —are covered in Toby Segaran's Collective Intelligence. {5}
Also covered is the access of real time data from eBay and other sources, which again is only briefly summarized here.
Real Time Data
Rather than manually search for data, which is time-consuming and prone to error, larger companies are increasing using programs that automatically source real time data and perform the necessary analyses on their own computers, thereby remaining continuously up to date. In this case you might want to use price comparison sites, but eBay remains the best choice in many market sectors. eBay has millions of users and sets prices by auction, i.e. by collective intelligence. That vast body of information can be 'tapped into' through eBay's API (Application Programming Interface: a particular set of rules and specifications that software programs can follow to communicate with each other) and in broad outline the steps would be:
1. Obtain a developer key, application key, certificate key and the
authentication token.
2. Write a program that extracts the title, price and features through
an eBay API call.
3. Analyze this data with kNN programs.
Sources 4 and 5 below provide the code needed.
Resources
1. Free
Statistics. Good listing of open source and freeware statistics
packages.
2. Wil's
Domain. Straightforward listing of statistics software, both free
and commercial.
3. Statistical
Analysis Software Survey. Useful tables if you're familiar with
statistics packages.
4. Python
Resources in One Place. Codes for many applications.
5. Java
Programming Resources. Tutorials, compiler and resources.
6. CPAN. Comprehensive
Perl Archive Network.
7. Innocentive.
Offers a marketplace where 160,00 engineers and scientists cooperate
to solve problems.
8. YourEncore.
Offers a network of retired and veteran scientists and engineers providing
our clients with proven experience.
 Questions
1. What matters need to be weighed when setting a price?
2. Give the advantages and disadvantages of common pricing models.
3. Explain the k-nearest neighbor (kNN) approach.
4. What is cross validation?
5. What further measures are needed to deal with uneven data?
6. Explain, in outline, how you would use real time data from eBay.
 Sources
and Further Reading
Sources
and Further Reading
1. Ten Top Product Pricing Models for Startups
by Marty Zwilling. Hot
Sauce. February 2011.
2. Define and price for your market starting at end market values!
by Mark Abraham. Sticky-Marketing.
April 2001.
3. An overview of Pricing Models for Revenue Management by Gabriel
Bitran and René Caldentey. MIT.
2002. Dynamic pricing: technical.
4. Algorithms of the Intelligent Web by Haralambos Marmanis and
Dmitry Babenko. Manning Publications. June 2009. A later and probably
better book than Segaran's, with specimen code in Java.
5 Programming Collective Intelligence: Building Smart Web 2.0 Applications
by Toby Segaran. O'Reilly. August 2007. Includes specimen code in Python.
6. k-NN Nearest Neighbors. StatSoft.
Simple but extended look at kNN approaches.
7. User Guide to K-Nearest Neighbor (kNN) and Linear Discriminant
Analysis (LDA) UCM.
How a software analysis program typically operates.